The Russian campaign, after Minard: a homage in motion
Nine points, each on a detail of the original: what Minard drew, and how to read it.
1. Carte figurative (a figurative map), 1869

Many call it the best statistical graphic ever drawn: one picture tells what became of Napoleon's army in Russia, in 1812. Charles Joseph Minard (1781-1870), a retired inspector general of France's civil engineering corps, drew it in November 1869, at 88.
Minard's words
Figurative map of the successive losses in men of the French Army in the Russian campaign, 1812-1813. Drawn by M. Minard, Inspector General of Bridges and Roads, retired. Paris, 20 November 1869. The numbers of men present are shown by the widths of the coloured zones, at one millimetre for ten thousand men; they are also written across the zones. Red stands for the men who enter Russia, black for those who leave it. The information used to draw the map was taken from the works of Thiers, Ségur, Fezensac and Chambray, and from the unpublished diary of Jacob, the Army's pharmacist since 28 October.
Carte Figurative des pertes successives en hommes de l’Armée Française dans la campagne de Russie 1812-1813. Dressée par M. Minard, Inspecteur Général des Ponts et Chaussées en retraite. Paris, le 20 Novembre 1869. Les nombres d’hommes présents sont représentés par les largeurs des zônes colorées à raison d’un millimètre pour dix mille hommes ; ils sont de plus écrits en travers des zônes. Le rouge désigne les hommes qui entrent en Russie, le noir ceux qui en sortent. Les renseignements qui ont servi à dresser la carte ont été puisés dans les ouvrages de M.M. Thiers, de Ségur, de Fezensac, de Chambray et le journal inédit de Jacob, pharmacien de l’Armée depuis le 28 Octobre.
Source: Tufte's text, on Closeread (EN), Sandra Rendgen, Minard's system, on Visionscarto (FR)
Source: Michael Friendly, Minard's life (EN), in French (FR)
2. Why he drew it

His legend gives his aim: to let the eye judge better how the army shrank. He had seen war himself, as a young engineer at Antwerp in 1813. His son-in-law wrote that the map inspires "bitter reflections on the human cost of the thirst for military glory".
Minard's words
To let the eye judge better how the army shrank, I have assumed that the corps of Prince Jérôme and of Marshal Davout, which had been detached toward Minsk and Mogilev and rejoined near Orsha and Vitebsk, had always marched with the army.
Pour mieux faire juger à l’œil la diminution de l’armée, j’ai supposé que les corps du Prince Jérôme et du Maréchal Davoust qui avaient été détachés sur Minsk et Mobilow et ont rejoint vers Orscha et Witebsk, avaient toujours marché avec l’armée.
Source: Minard's legend (FR)

Source: Michael Friendly, Minard's life (EN), in French (FR)
3. The width is the number of men
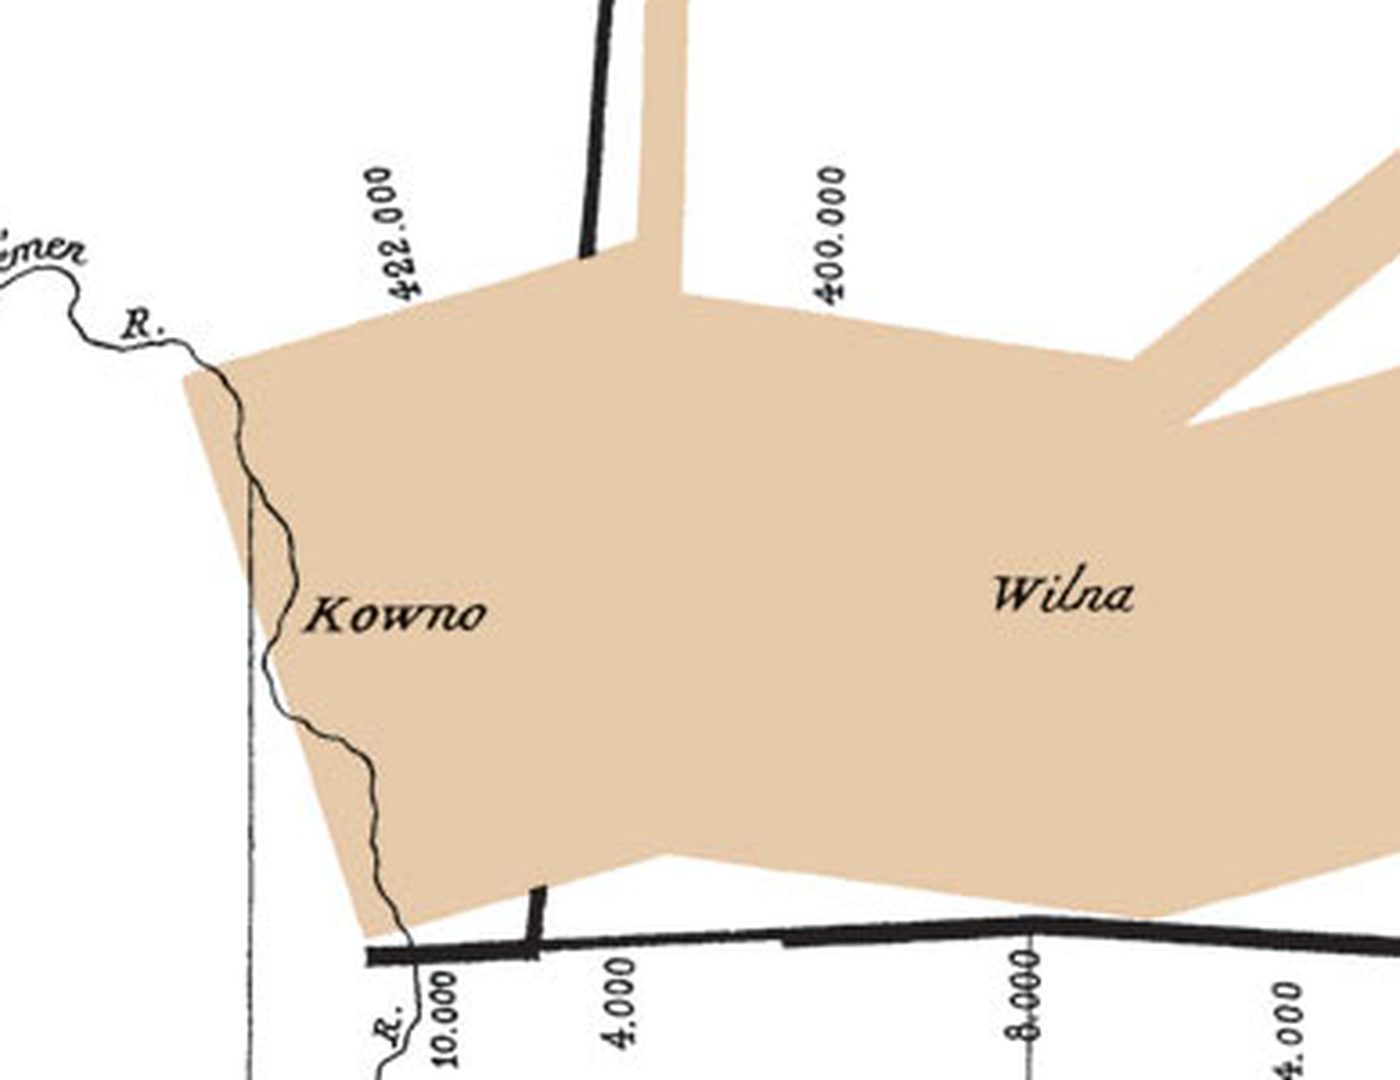
One millimetre for 10,000 men, says the legend. In June 1812, 422,000 cross the Niemen into Russia: the tan band (red, in Minard's words).
Source: Minard's legend (FR)
4. A map: the army's position
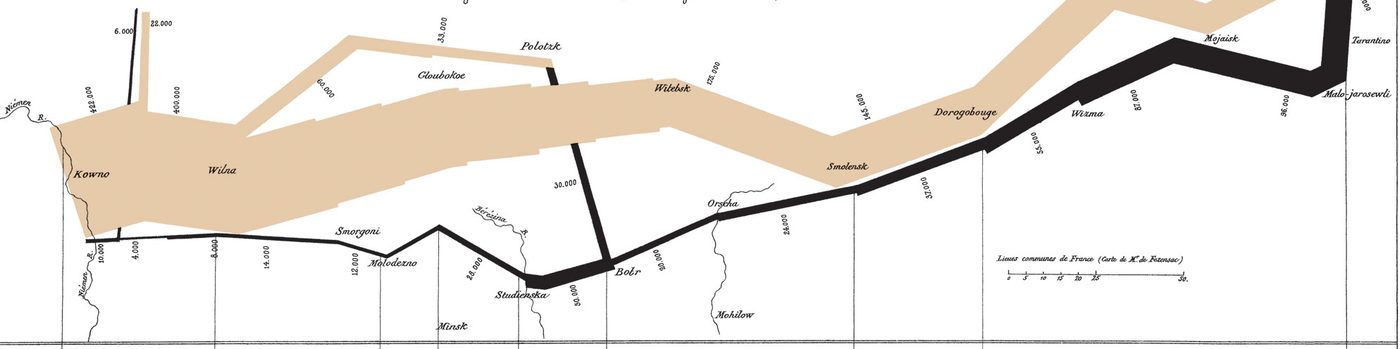
The band runs where the army marched, west to east, from the Niemen to Moscow: its position, longitude and latitude, is two more variables. The towns it passed and the rivers it crossed are named.
5. 100,000 reach Moscow
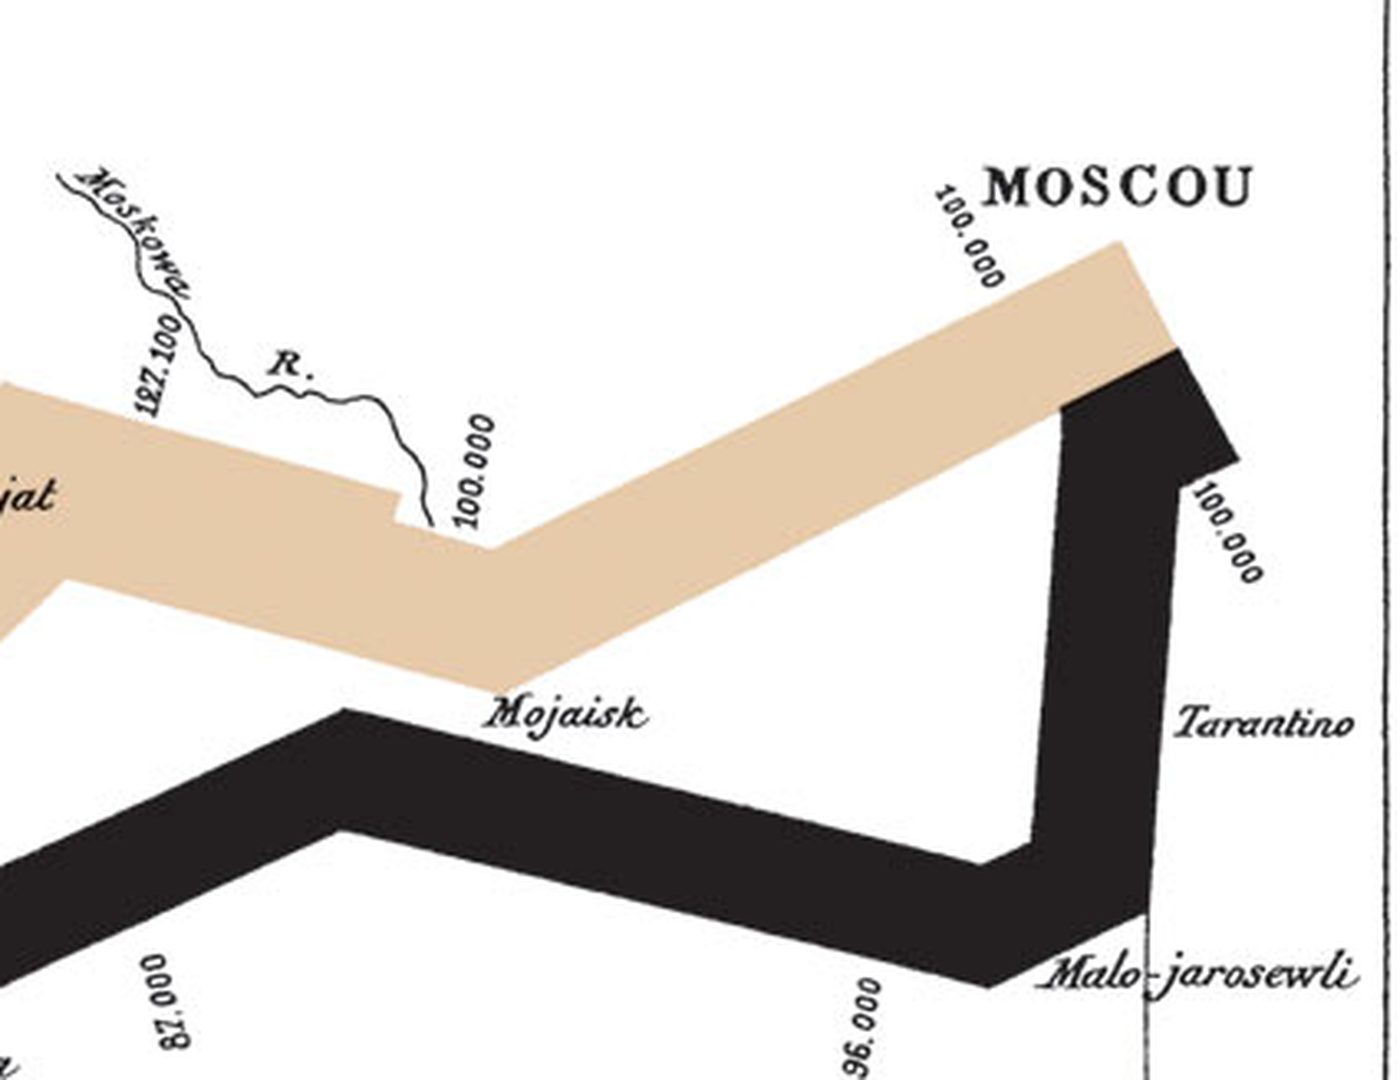
The band thins all the way to Moscow, in September. Its color gives the direction: tan going in, black for the way back.
6. 10,000 come back
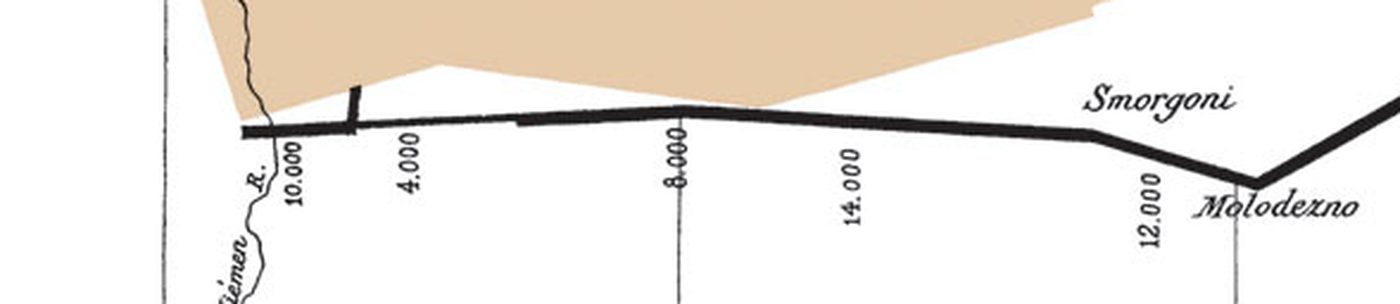
In December, the black band crosses the Niemen again: 10,000 men of the 422,000, by Minard's count.
Source: Minard's legend (FR)
7. The cold, and the dates

Below, the temperatures of the retreat, in degrees Réaumur, each dated and tied to the map by a thin line: down to -30° (-37 °C) on 6 December. They are the only dates of the campaign on the map.
8. Why it is famous
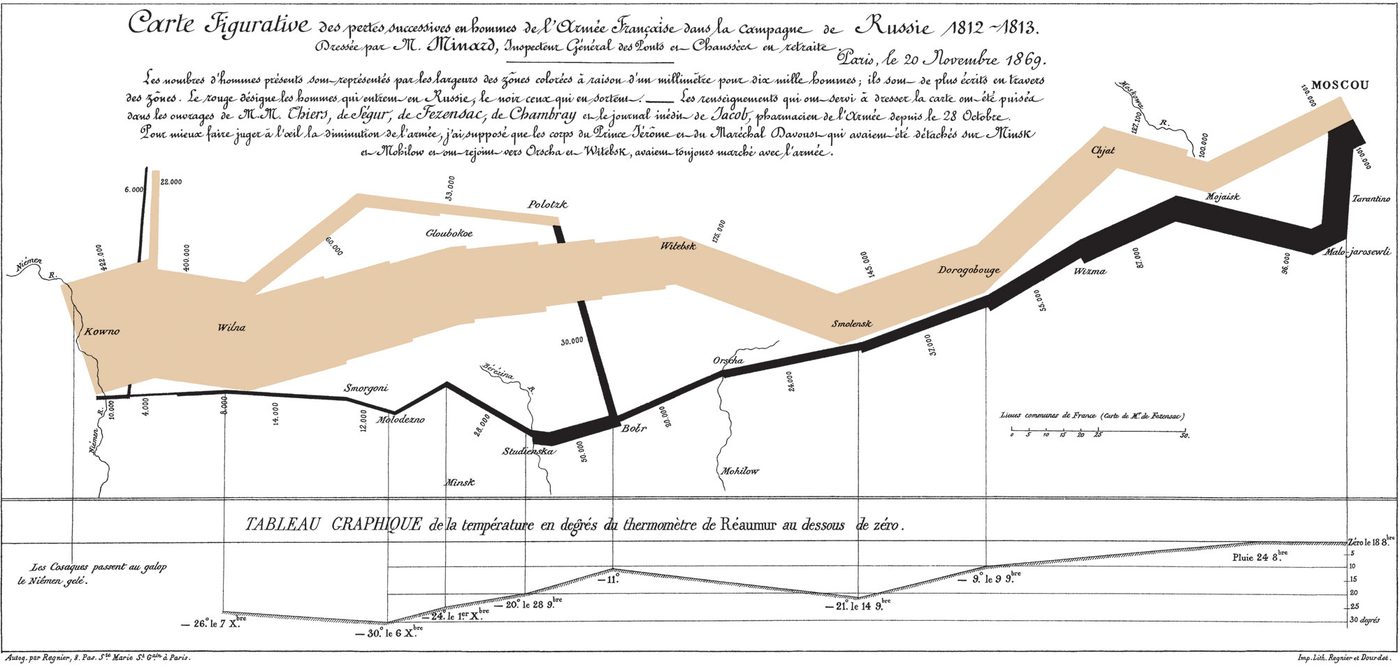
Six variables in one picture: the army's size, its position (longitude and latitude), its direction, the temperature and the dates. In 1878, the physiologist Étienne-Jules Marey wrote that its "brutal eloquence" seems to defy the historian's pen. In 1983, Edward Tufte: "It may well be the best statistical graphic ever drawn."
Source: Marey, La méthode graphique, 1878 (FR)
Source: Tufte's text, on Closeread (EN), Sandra Rendgen, Minard's system, on Visionscarto (FR)
Source: Numberphile's video: The Greatest Ever Infographic (EN)
9. Now, with time
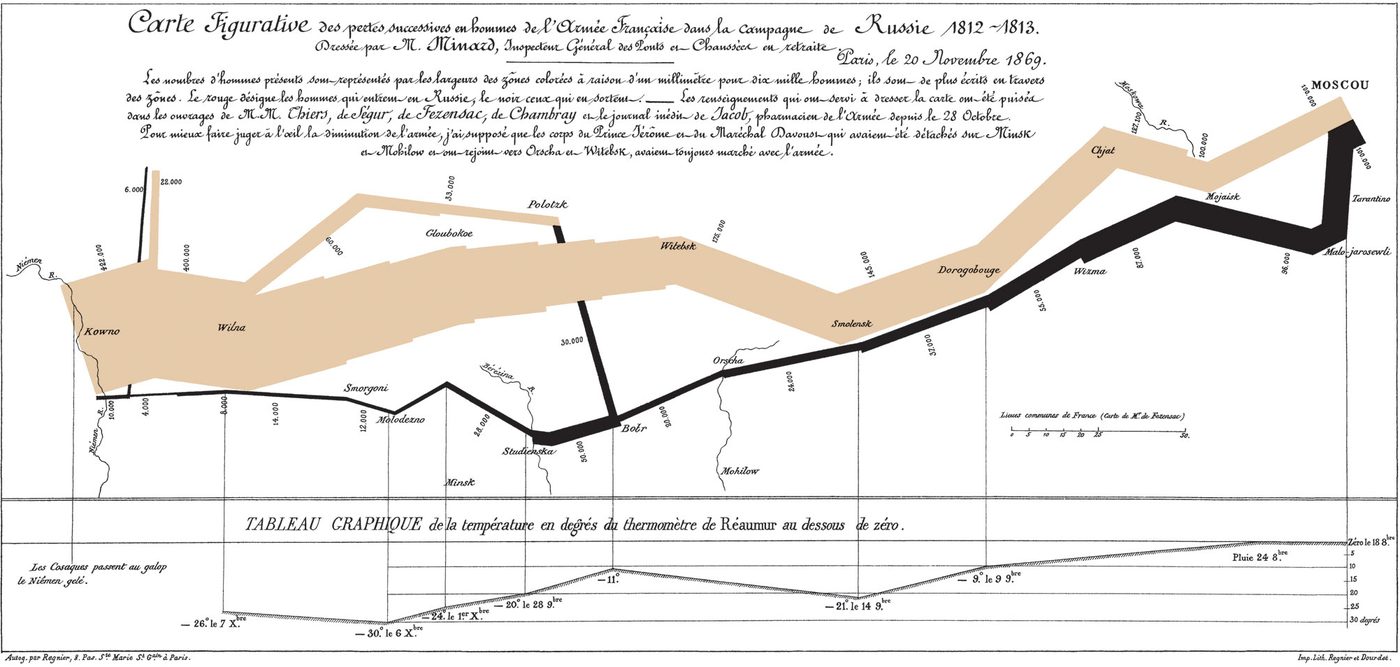
Minard's map has almost no dates. This app adds them, and replays the campaign day by day.